Through Python, we can easily approach the some of stock market data.
파이썬 라이브러리를 통하여 주식시장의 데이터를 쉽게 접근할 수 있습니다.
First of all, import libraries.
1. yfinance: Although this is not the official library, Yahoo finance library provides various data for free!
2. Pandas: This library offers various analytics functions and the performance of functions are much better than the original Python library because it has been compiled by C and utilizes the Numpy library inside of the library.
우선, 라이브러리를 임포트 합니다. 라이브러리의 함수들을 편하게 활용하기 위해서는 임포트 과정을 거쳐야 합니다.
공식적인 라이브러리는 아니지만 yfinance라이브러리를 무료로 사용하여 야후 금융 데이타를 가져올 수 있습니다.
판다스는 통계분석뿐만 아니라 다양하고 파이썬 기본 라이브러리보다 향상된 성능의 기능들을 제공합니다. 내부적으로는 C나 다른 저급언어들로 짜여져 있으며, 넘피의 라이브러리도 사용하므로 빠릅니다!)
Actually, the Numpy library is optimized by C language and SIMD(Single Instruction Multi Data) for better performance.
사실상, 넘피는 C언어와 SIMD를 활용함으로써 속도를 개선하였습니다. 참고로 SIMD는 셀레론 같은 저가형 CPU에서는 의미가 없으니 속도의 개선을 그다지 볼 수 없습니다.
Second, using the libraries to get and control the data.
Here is the code for Amazon Stock Daily Return Data between 2020/01/01 and 2022/04/27
(Dropped the empty data for analysis: dropna() )
두번쨰로 라이브러리를 활용하여 데이터를 가져오고 제어합니다.
2020년 1월 1일부터 2022년 4월 27까지의 아마존 일일 수익률을 가져오는 코드입니다.
(dropna()는 일자별 비어있는 무의미한 데이터는 통계를 위하여 제거해버립니다.)
Third, get the mean and standard deviation to get a z-score.
세 번째로 z-score값을 가져오기 위하여 평균과 표준편차 값을 구합니다.
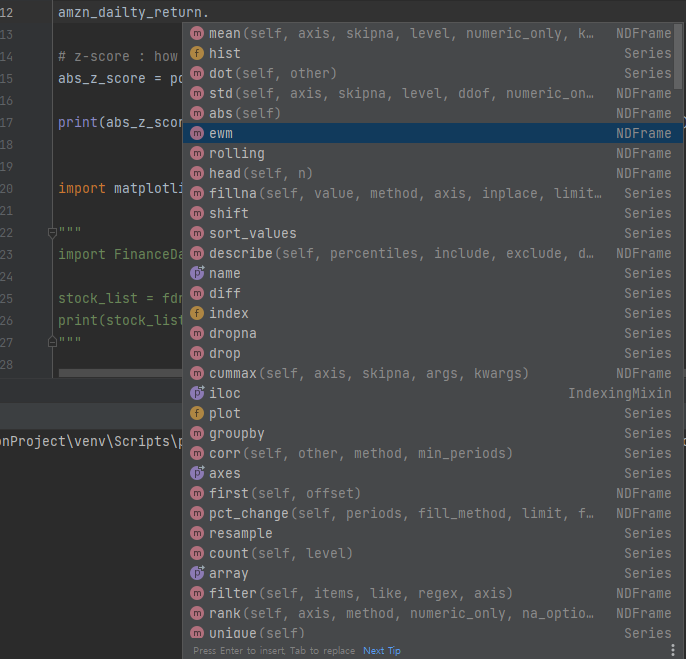
Pandas library provides various functions not only for statistical analysis, not for other functions to control data. check below!
참고로 판다스의 통계분석 및 데이터 제어 함수들을 보여드립니다. 다양한 함수들이 있으며 해당 함수는 Series 나 Dataframe을 통하여 활용할 수 있습니다.
Last, you can print the z-score that expresses how much deviated from the mean by absolute value.
z-score를 각각의 설정한 퍼센트에 따라서 출력합니다.
(. T는 가로와 세로를 전환한다고 보면 됩니다. 차후에 벡터 데이터 활용에 나름 유용하게 쓰입니다.)
Here is the full Python code!
파이썬 전체 코드입니다!
import yfinance as yf
import pandas as pd
data = yf.download('AMZN', start='2020-01-01', end='2022-04-27', progress=False)
amzn_dailty_return = pd.Series(data.Close.pct_change().dropna())
# amzn_dailty_return.hist(bins=20)
mean = amzn_dailty_return.mean()
std = amzn_dailty_return.std()
# z-score : how much deviated from the mean by absolute value
abs_z_score = pd.Series(amzn_dailty_return.sub(mean).abs().div(std))
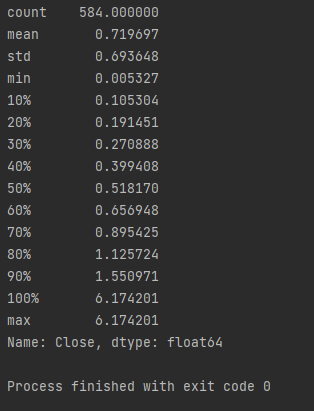
print(abs_z_score.describe(percentiles=[.1, .2, .3, .4, .5, .6, .7, .8, .9, 1]).T)
Then, we can get this data by percentiles.
각 퍼센트 별로 평균의 범위 수준을 출력합니다.
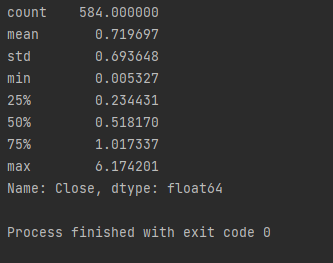
If you don't want to see by percentiles, simply use this code.
만약에 일일이 퍼센트별로 궁금하지 않다면 단순히 아래와 같이 사용하시면 됩니다.
print(abs_z_score.describe().T)
Thank you!
깜쌈돠~
'Quantitative Study for Finance' 카테고리의 다른 글
| ATR & Turtle Trading (2) | 2023.08.15 |
|---|---|
| Time Series GAN | 시계열 적대적생성 네트워크 (1) | 2023.08.12 |

